


Which vacancy rate is your landlord quoting?
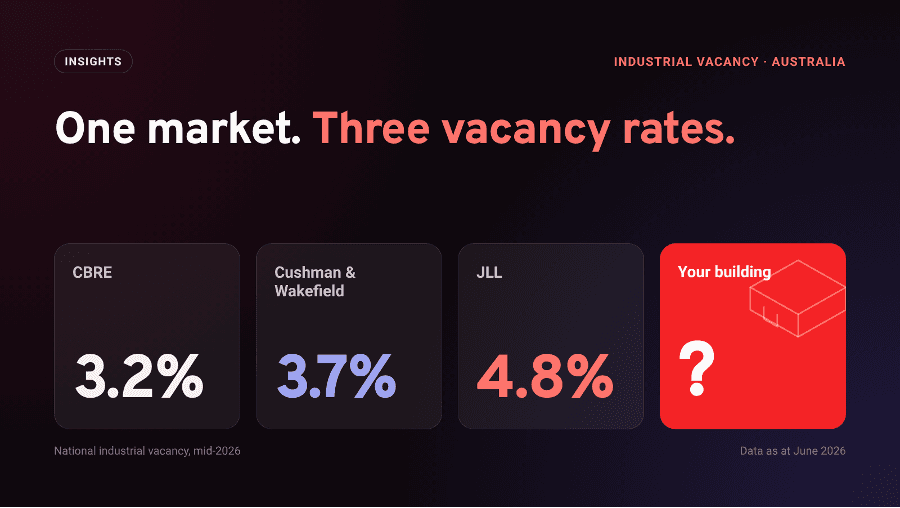
Australia's industrial vacancy rate is 3.2%. Or 3.7%. Or 4.8%. The number you negotiate with decides how much leverage you bring to the table.
The short version
- Four respected research houses put Australia's mid-2026 industrial vacancy anywhere from 3.2% to 4.8%. None is wrong. Each counts different things.
- In a lease negotiation, that gap is leverage. Whoever chooses the number frames the deal.
- The bigger gap is inside the market. The only vacancy rate that matters is the one for your precinct, size and grade.
What is an industrial vacancy rate? It is the share of warehouse and logistics floorspace that is available to lease. For mid-2026, Australia's national figure is 3.2% (CBRE), 3.7% (Cushman & Wakefield) or 4.8% (JLL). Each house measures it slightly differently, which is why the numbers disagree.
Picture a lease renewal in Western Sydney this month.
The landlord's agent opens with the market. Vacancy is just over 3% nationally, comfortably below the 4% level often treated as balanced. Developers have pulled back from speculative building, meaning warehouses built before a tenant has signed. The rent on the table is fair.
Every word is accurate. But another respected source, published the same month, puts national vacancy at 4.8%. That is half as much empty space again, and above the balanced line.
Same warehouses. Same months. Both figures are right. Which one ends up on the table shapes everything that follows.
Australia's industrial vacancy rate in 2026: four houses, four numbers
Australia's industrial market is tracked by a handful of global research houses. Their mid-2026 releases agree on the story and disagree on the number.
CBRE put national vacancy at 3.2% for the first half of 2026 and called it close to the cyclical peak. Cushman & Wakefield said 3.7% for the June quarter. JLL said 4.8%, down from 5.0%. Knight Frank publishes city figures rather than a national one. Side by side, the gap between them is often bigger than the change any of them recorded over the half-year.
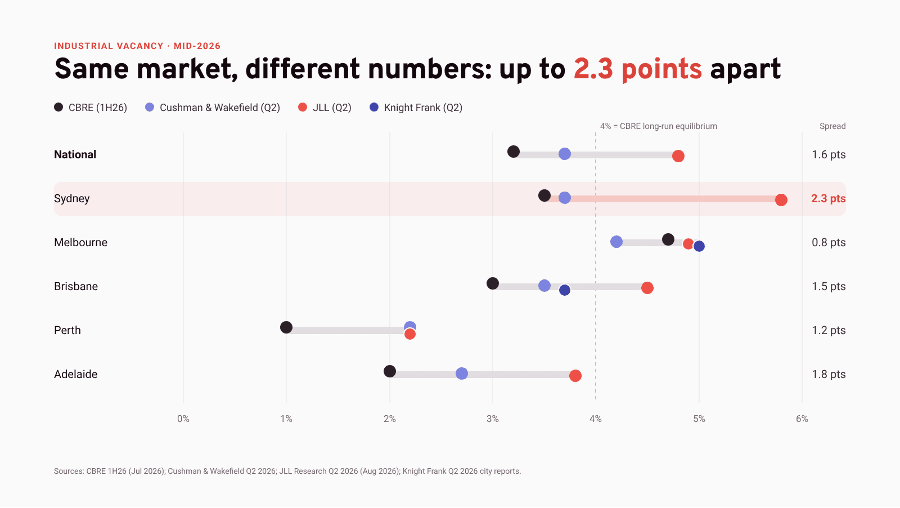
Sydney's readings run from 3.5% (CBRE) to 5.8% (JLL). Adelaide's run from 2.0% to 3.8%. Even Melbourne, where all four houses publish a figure, spans 0.8 of a point.
They do not agree on direction either. For the June quarter, JLL said Melbourne vacancy fell. Cushman & Wakefield said it rose. Knight Frank said it keeps rising.
How industrial vacancy is measured: a definition before a number
Think of unemployment. The Australian Bureau of Statistics publishes an unemployment rate and an underemployment rate every month. Both are accurate. They count different people. Quoting one means choosing which question to answer.
Vacancy works the same way. The research houses make three different choices:
- Which buildings count. CBRE tracks buildings over 5,000 square metres in Sydney and Melbourne, and over 3,000 square metres elsewhere. Knight Frank counts vacancies of 5,000 square metres and above.
- Whether sublease space counts. This is space a tenant no longer needs and offers to others. CBRE includes it. JLL splits it out: 4.1% direct vacancy plus 0.7% sublease makes its 4.8%.
- Whether unfinished buildings count. Knight Frank includes speculative warehouses due for completion soon. CBRE counts only space that is built and available now.
Here is how the four houses compare on what their public releases disclose:
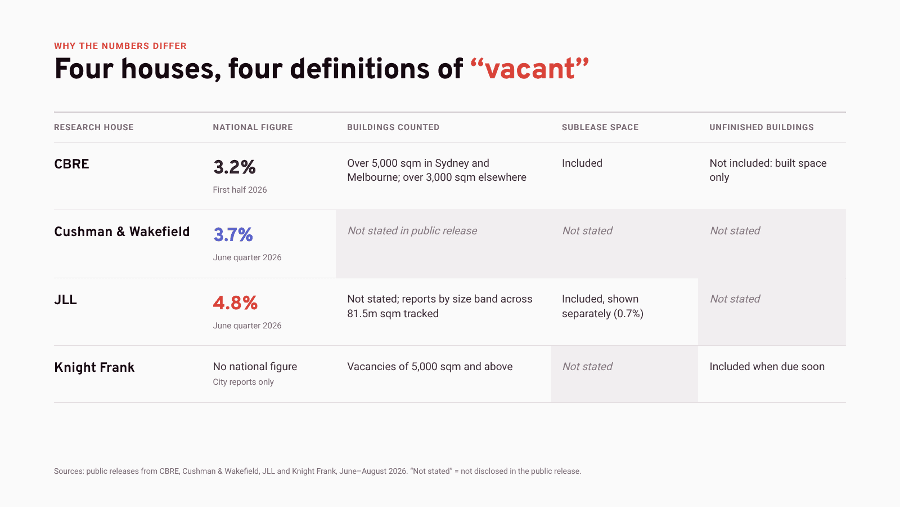
Timing differs too: CBRE reports half-yearly, the others quarterly. Where a method is "not stated", it may still be documented in full subscriber reports.
None of this makes a figure unreliable. It makes each one specific. The problem starts when a specific number is used as if it were universal.
Why the vacancy rate matters in a lease negotiation
In a lease negotiation, the vacancy rate is the opening argument. It frames how scarce space is, and scarcity decides who gives ground.
Nobody needs to be dishonest for this to go wrong. Each side reaches for the reputable figure that suits it. A tenant who has not checked accepts the lowest one as "the market".
Much of what is at stake sits in incentives: the rent-free periods and fit-out contributions landlords offer to win a tenant. Cushman & Wakefield puts them at 12.5% to 23% on existing prime space in Sydney. Knight Frank records an average of 26.1% in Melbourne's West, with some deals at 30% or more.
Headline rent hides this. In Melbourne's South East, Knight Frank found face rents up 9.4% in a year. Over the same period, average incentives rose from 16.9% to 23.3%, offsetting much of the gain. Read the headline, and the market moved against tenants. Read the whole deal, and it moved their way.

The timing makes this pressing. JLL's head of strategic research, Annabel McFarlane, notes that many occupiers signed five-year leases in 2021, when vacancy was 1 to 2%, and took whatever space they could find. Those leases are expiring now. Accept the wrong reading of the market, and you risk renewing on 2021 terms in a 2026 market.
Does the difference really matter? Three objections
There are three fair objections.
"The houses agree on direction, so why argue about decimals?" Vacancy has stopped rising. Knight Frank expects east-coast completions to fall a further 20% in 2026. Developers increasingly want a tenant signed before they build. All true. But when everyone agrees the market is easing now and will tighten later, the one thing left to negotiate is how much room exists today. That is a question about level.
"Quoting the highest figure is cherry-picking too." Also true. The answer is not a bigger number. It is knowing what each number measures and using the one that matches your situation.
"Tenants will pay more anyway." Centuria Industrial REIT re-leased space at rents averaging 30% above the expiring leases in the year to June 2026. That strengthens the argument. When rent resets upward, incentives, fit-out and lease terms are where value is won back, and each depends on how much slack the market really has.
There is also a bigger issue underneath. The disagreement between the houses is small next to the differences inside any single market.
Your warehouse does not have a national vacancy rate
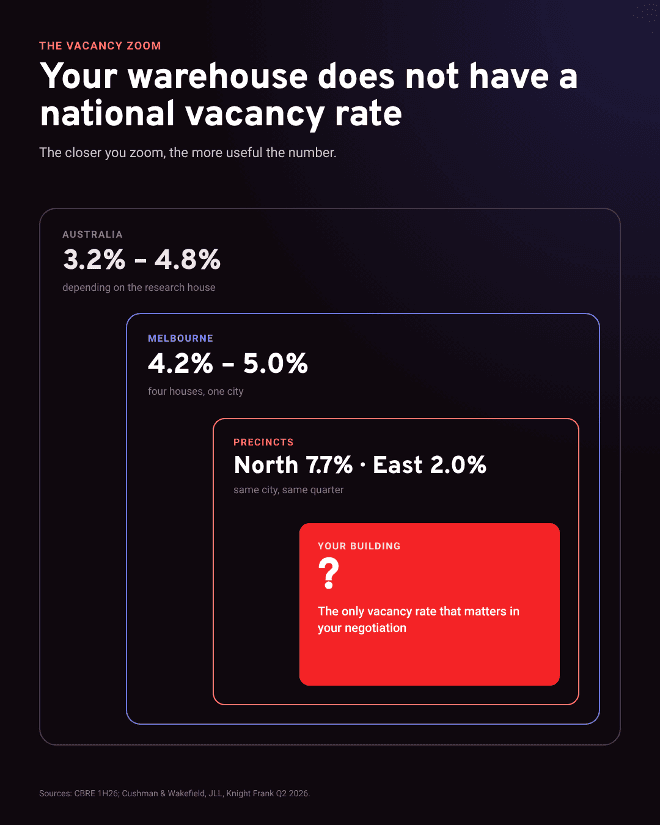
This is the idea to take into your next negotiation. The question is not which house to believe. It is which slice of the market your building sits in: its precinct, its size and its grade.
Precinct
Knight Frank's June-quarter data puts vacancy in Melbourne's North at 7.7% and in the East at 2.0%. Same city, same quarter, nearly four times the empty space. A tenant in the North who negotiates against the citywide figure leaves leverage on the table. A tenant in the East who quotes it overplays their hand. (JLL reads the North at 5.4%: definitions matter even at precinct level.)
Grade
CBRE reports that vacancy is concentrating in older prime and secondary buildings, while modern super-prime facilities (the newest, highest-specification warehouses) outperform. JLL expects the higher vacancy risk to sit in secondary-grade space. The discounts are real, but they sit mostly on last season's stock.
Size
JLL's June-quarter data shows national vacancy of 6.1% for buildings of 10,000 to 30,000 square metres, the highest of any size band, driven by recent speculative development. For buildings of 30,001 to 45,000 square metres, it is 2.3%. A national figure shows neither.
The widest gap between two houses' readings of a city is 2.3 points, in Sydney. The gap between two precincts in the same city, on one house's numbers, can be more than five.
A vacancy rate is only useful when it describes the building you are negotiating for. Everything else is context.
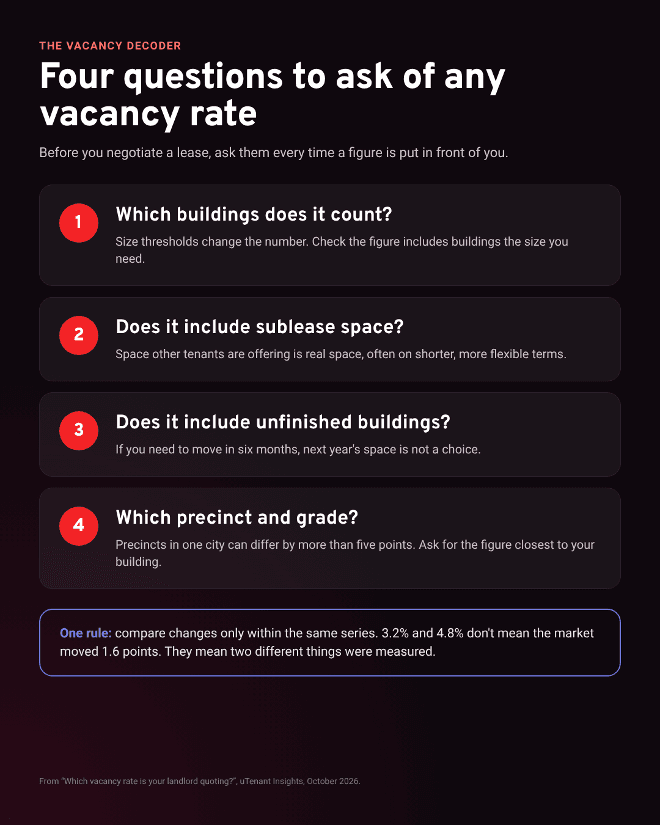
Four questions to ask of any industrial vacancy rate
Ask these every time a figure is put in front of you.
- Which buildings does it count? If your requirement is 8,000 square metres and the figure blends every size, it may not describe your options.
- Does it include sublease space? If so, part of the "vacancy" is other tenants' surplus, often on shorter, more flexible terms. That can be an opportunity in itself.
- Does it include unfinished buildings? If you need to move in six months, next year's space is not a choice. If you can plan ahead, it may be your best lever. And if you need capacity before the right building is ready, flexible 3PL storage can bridge the gap.
- Which precinct and grade does it describe? Ask for the figure closest to your building. If nobody has one, treat city and national numbers as context, not evidence.
One rule follows: compare changes only within the same series. CBRE's 3.2% and JLL's 4.8% do not mean the market loosened by 1.6 points. They mean two different things were measured.
Then act on what you find.
- Negotiate the whole deal. Where face rents are flat or rising but incentives are high, the value lies in rent-free periods, fit-out and term flexibility. Compare offers on effective rent: what you actually pay once incentives are counted.
- Count the full cost. CBRE's Western Sydney team notes that older buildings are harder to lease as occupiers weigh total occupancy cost and rising outgoings. A bigger incentive on a less efficient building is not automatically the better deal.
- Mind the clock, and your precinct. CBRE expects incentives to stabilise, then fall gradually from late 2026. If your lease event falls in 2026 or 2027, today's room is unlikely to last. But local supply can reverse the trend: Knight Frank expects a record 421,000 square metres of new space in Melbourne's North in 2027, reopening choice there just as the wider market tightens.
Where uTenant fits
The research houses publish excellent data, built to describe whole markets. Tenants need a view of their own slice of it. That is the gap uTenant's Property Matching service is built for.
Our Property Matching starts from the tenant's requirement, not the market average. A tenant enters the size, location and specification they need. The uTenant team then builds a tailored list of options, including off-market properties, and helps compare, shortlist and inspect them. The service is free and confidential for tenants. For tenants approaching a lease event, it helps answer the practical question behind this article: should we move, or should we renegotiate where we are?
The four questions above work without any software. We would rather tenants used them than trusted any headline figure.
Disclosure: uTenant's property matching is supported by JLL, one of the four research houses quoted in this article. JLL's figures here are taken from its own published research, alongside those of the other houses.
Whose, and of what?
Australia's industrial market is at a turning point. Vacancy has stopped rising, incentives are high and supply is falling. Almost everyone agrees on that.
But consensus is not leverage. Leverage is knowing how much choice exists for the building you need, today, and being able to show it.
So the next time someone tells you what the vacancy rate is, ask a short question back: whose, and of what?
Approaching a lease event in the next two years? Submit your property requirement and see what the market looks like for your building, not the average one.
Frequently asked questions
What is the industrial vacancy rate in Australia right now?
For mid-2026, it is 3.2% according to CBRE (first half of 2026), 3.7% according to Cushman & Wakefield and 4.8% according to JLL (both June quarter). Perth is the tightest major market on every measure, at 1.0% to 2.2%.
Why do CBRE and JLL report different vacancy rates?
They measure slightly different things. The houses differ on which building sizes they count, whether sublease space is included, whether unfinished speculative buildings are included, and how often they report.
What is a healthy vacancy rate for industrial property?
CBRE describes 4% as the sector's long-term equilibrium threshold, the level it treats as balanced. Most of CBRE's own city figures sit below it; Melbourne, at 4.7%, is the exception. JLL's readings for Sydney (5.8%) and Melbourne (4.9%) sit above it.
Does sublease space count as vacancy?
It depends on the source. CBRE includes sublease space in its vacancy rate. JLL includes it but also reports it separately: 0.7% of its 4.8% national figure in the June quarter of 2026.
What is the difference between face rent and effective rent?
Face rent is the headline rent written into the lease. Effective rent is what a tenant actually pays once incentives, such as rent-free periods and fit-out contributions, are taken into account. When incentives are high, effective rent can fall even while face rent rises.
Is now a good time to renew a warehouse lease?
CBRE says leasing conditions favour occupiers in the near term, and expects incentives to stabilise and then fall gradually from late 2026. Whether that applies to you depends on your precinct, building size and grade, which is why the questions above matter.
Sources
- CBRE (7 July 2026), Australia's national industrial & logistics vacancy remains steady at 3.2%
- CBRE Research (30 June 2026), Australia's Industrial & Logistics Vacancy Report 1H26
- CBRE Research (13 July 2026), Australia Industrial and Logistics Figures Q2 2026
- CBRE Research (13 April 2026), Australia Industrial and Logistics Figures Q1 2026
- Cushman & Wakefield, Morgan Evans (21 July 2026), The Industrial Market Rebalances: Opportunity Emerges for Occupiers Who Plan Ahead
- Mingtiandi (30 July 2026), Australia Industrial Leasing Outperforms as Vacancy Tightens in Q2: C&W
- JLL Research, Annabel McFarlane and Rick Warner (17 August 2026), Q2 2026 Australian Industrial Market Analysis
- The Urban Developer (31 July 2026), Australia's Industrial Vacancy Falls as Demand Stays Strong
- Knight Frank Research (2026), Melbourne Industrial State of the Market Q2 2026
- Knight Frank Research (2026), Sydney Industrial State of the Market Q2 2026
- Knight Frank Research (2026), Brisbane Industrial State of the Market Q2 2026
- Knight Frank Research (2026), Australian Industrial Review Q1 2026
- Centuria Industrial REIT (11 August 2026), FY26 Results Announcement
- Australian Bureau of Statistics, Labour Force, Australia
Figures are as at June 2026, the latest published by each house at the time of writing. This article will be updated when new half-year data is released.